Solutions
Guide
See how to review and compare Standing data, Coverage, and Efficiency after the same launch.
- 1. Read the status and quick metrics on each frontier level.
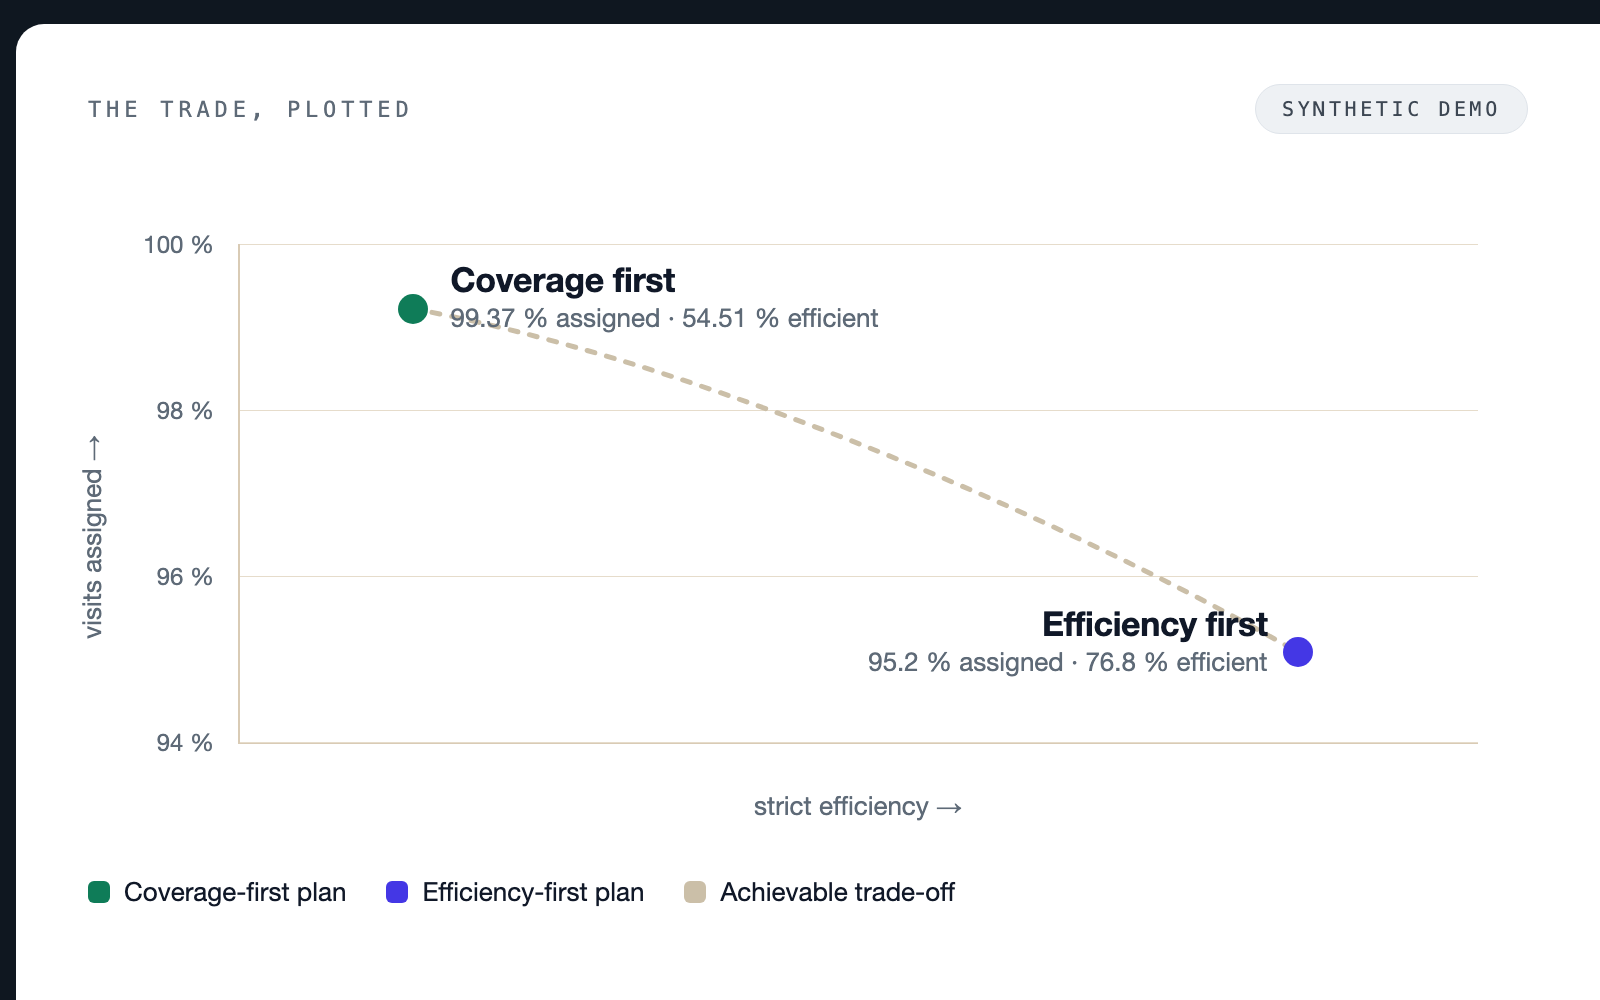
- 2. Read the Pareto trade-off.
- 3. Open the calendar and diagnostics for a selected option.
- 4. Investigate a coverage gap before publishing.
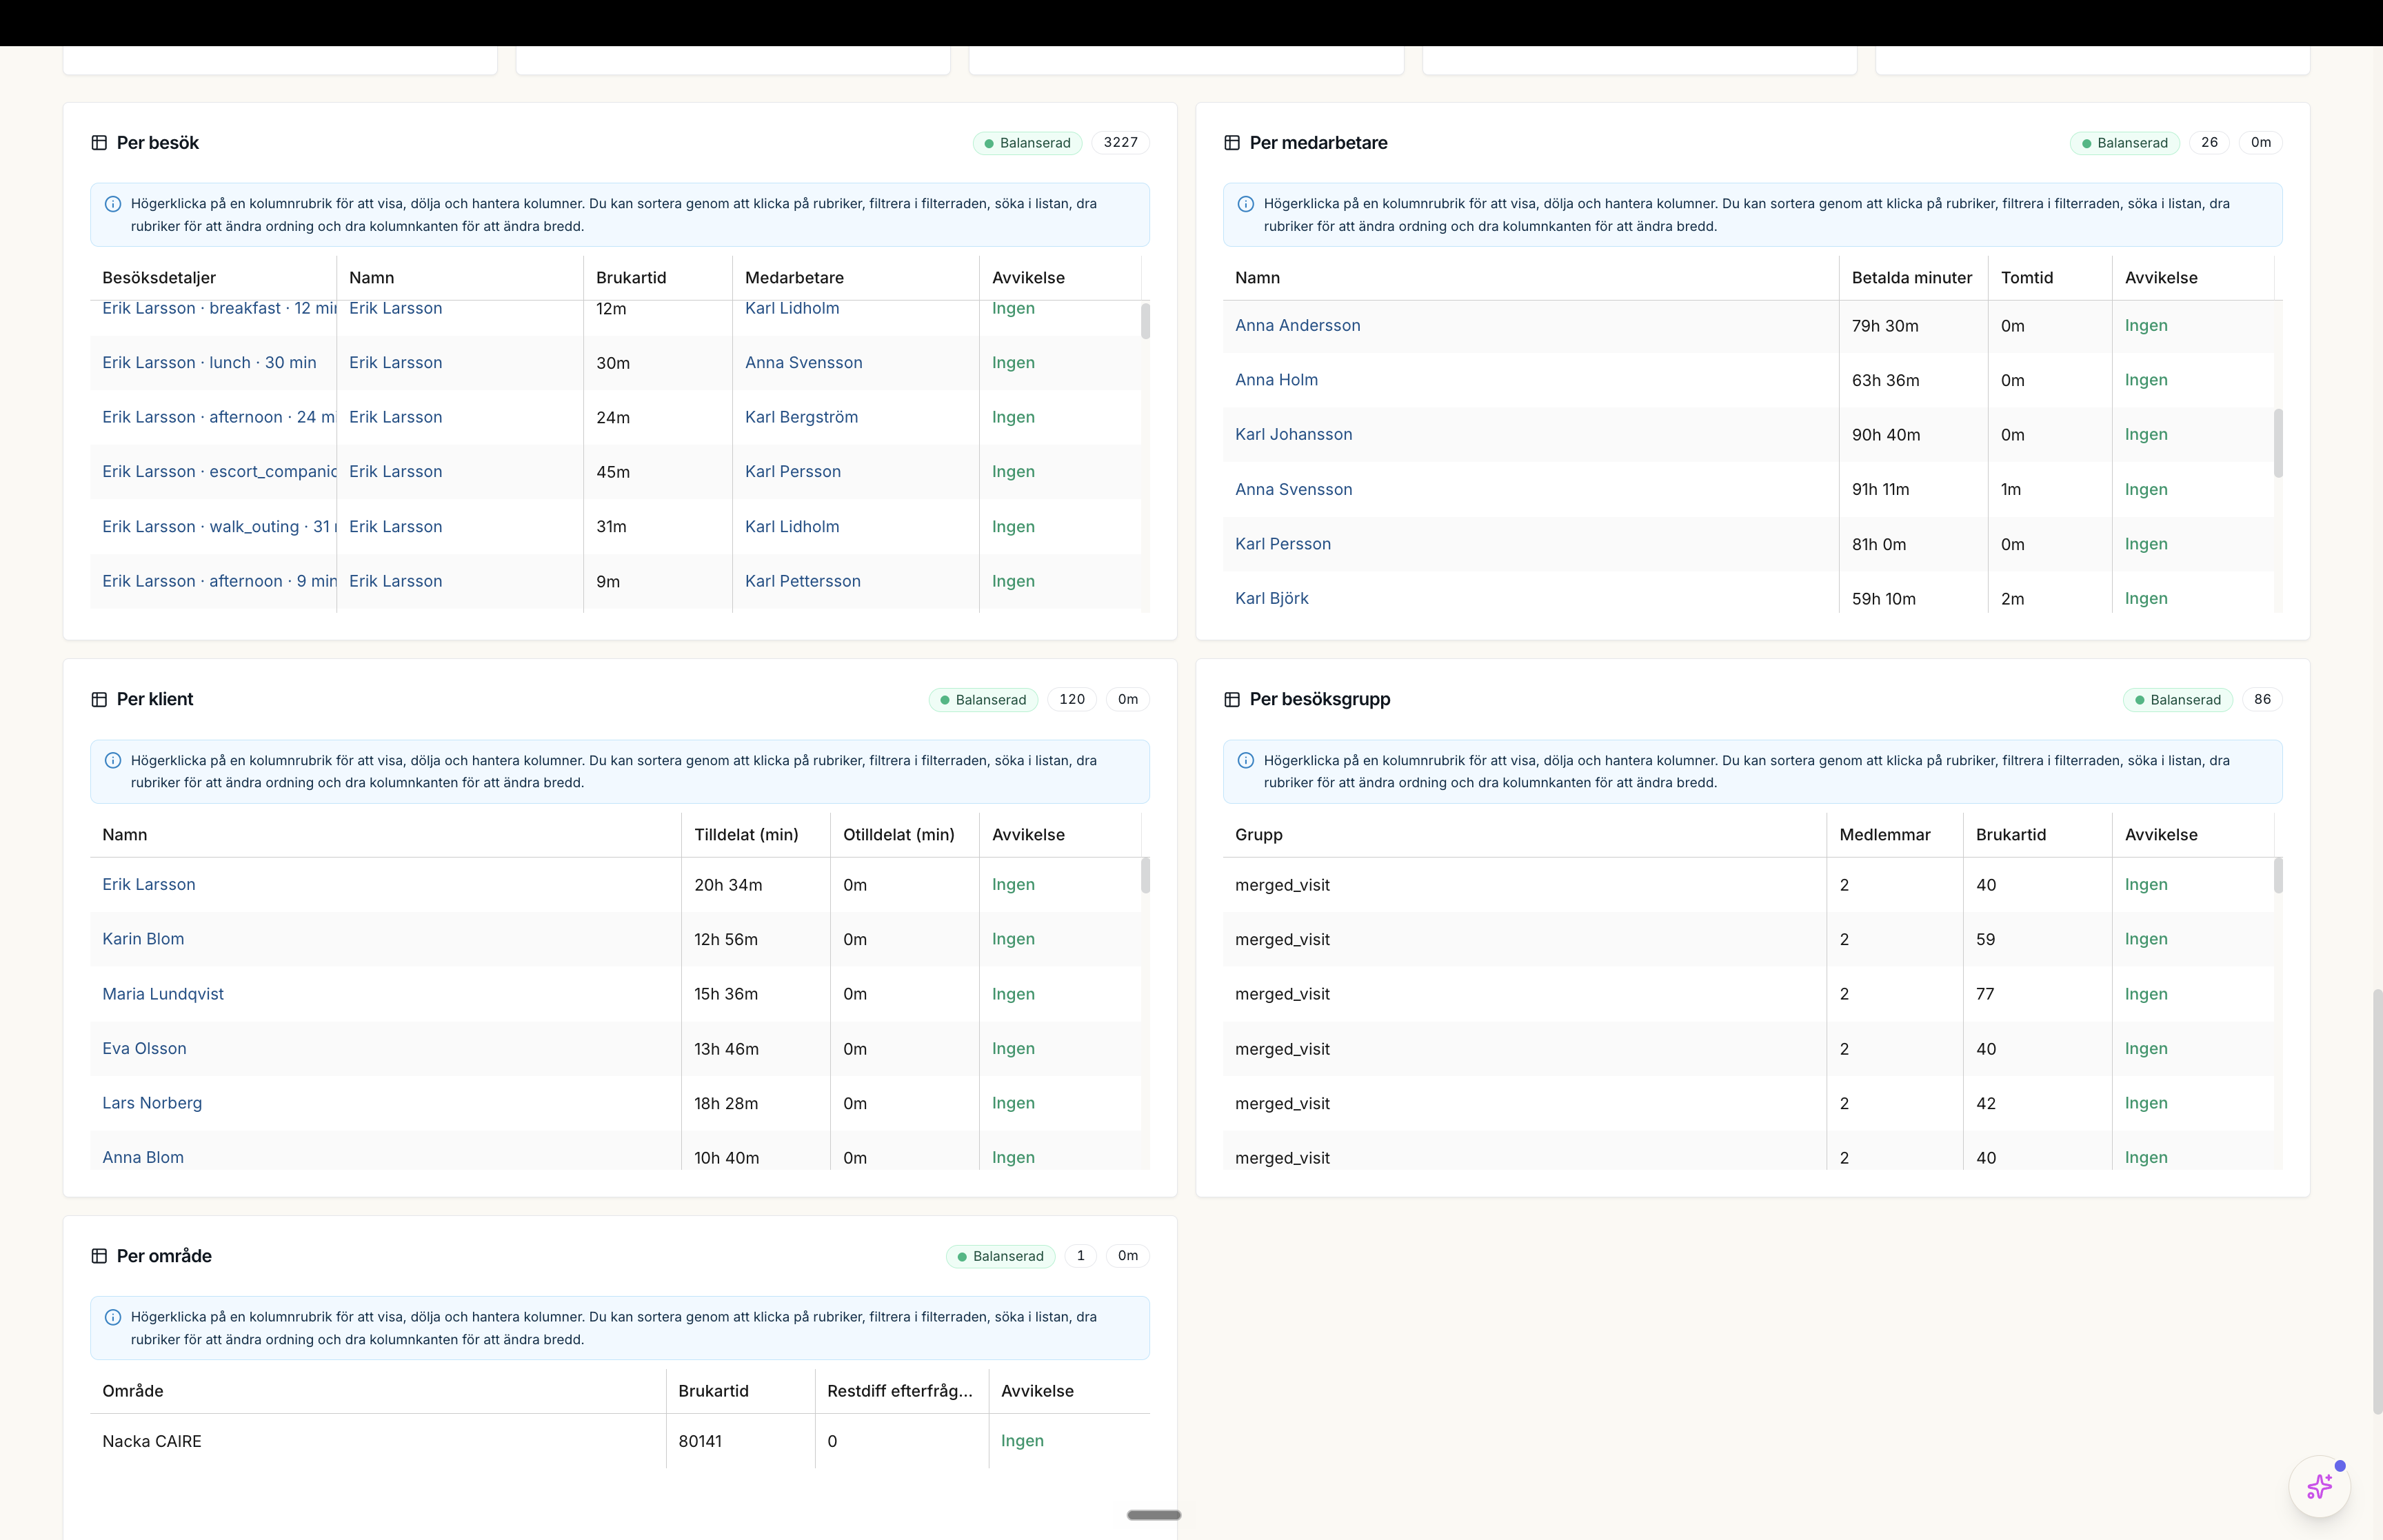
Insikter breaks the reconciliation down by visit, employee, client, visit group, and area.
Fields and use
| Field | Level | Why it matters | Used for |
|---|---|---|---|
| Result status | First schedule | Shows whether the option is complete or complete with a coverage gap. | A coverage gap can be compared and diagnosed but cannot be published. |
| Card quick metrics | Better metrics | Shows unassigned visits, client time of paid time, paid time without visits, blocked matching, missing capacity, and fixed/flex shifts. | A quick check of each option before opening the broader comparison. |
| Read the solution frontier | Better metrics | Shows the trade-off between visit assignment, time composition, quality profile, and detailed solution metrics. | Choosing what to review next in the calendar and diagnostics. |
Where it appears