Analytics

    Detailed analysis and insights to improve your operations

    100+Reports & Views
    98%Data Accuracy
    24/7Real-time Data
    20%Efficiency Gain
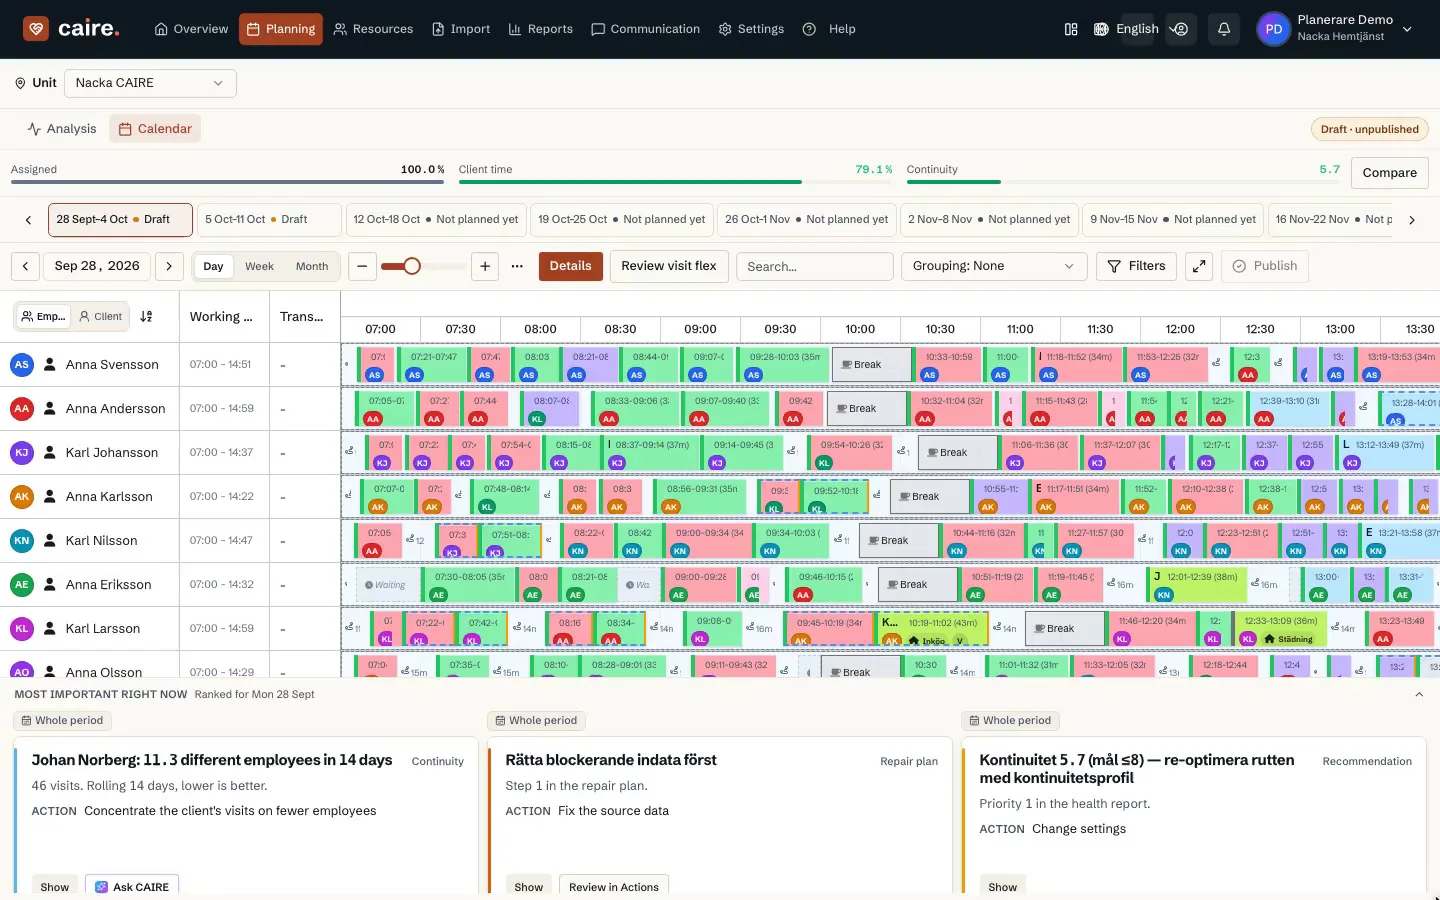
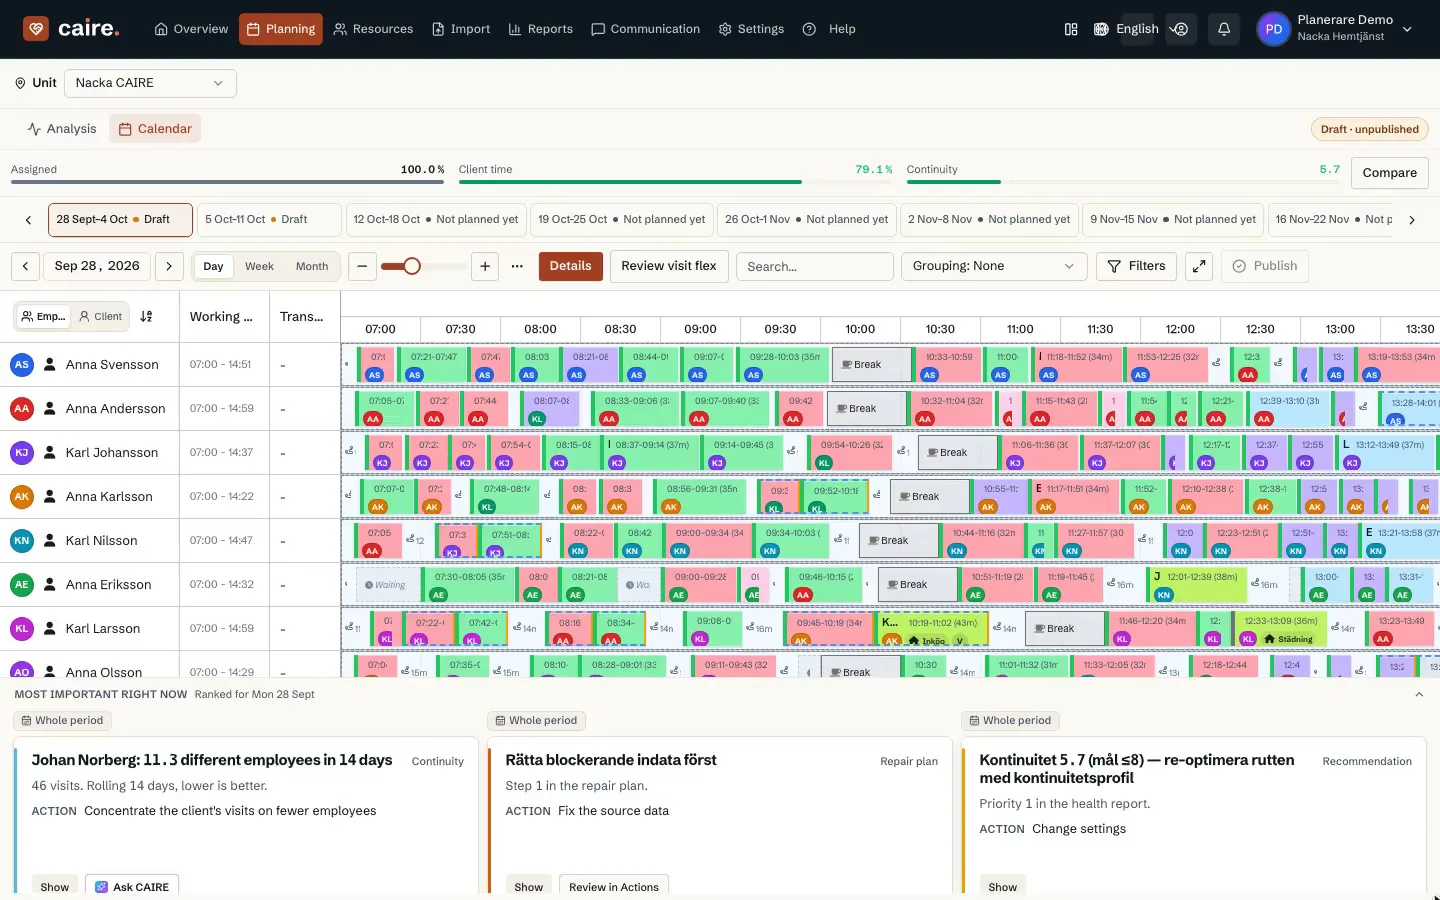
    Caire analytics view showing demand and capacity diagnostics for Nacka
    Demand, capacity, utilization, and schedule diagnostics use the same planning data.

    Current page

    Analytics

    Track quality, capacity, economics, and improvement over time.

    Comprehensive analytics suite

    Key performance indicators across quality, capacity, and economics

    Caire combines schedule analytics, resource analytics, Financial analytics, and Operational analytics so leaders can track baseline, demand, supply, utilization, continuity, cost, and improvement over time.
    Caire analytics dashboard screenshotCaire analytics dashboard screenshotCaire analytics dashboard screenshot

    Powerful Data Analytics

    Turn complex data into clear, actionable insights. Our analytics platform combines advanced data processing with user-friendly interfaces to give your operation a knowledge edge in every decision.

    • Real-time DataContinuous updates for up-to-date insights
    • Opportunity IdentificationDiscover opportunities for improvement in your operation
    • Goal TrackingContinuous follow-up against operational goals
    Caire analytics overview with operational KPIs, efficiency trend, and schedule distribution

    Powerful Visualization

    Clear insights for better decisions

    Comprehensive Reporting

    Schedule Reports

    • Schedule optimization
    • Coverage Analysis
    • Time Distribution
    • Route planning
    • Contract compliance

    Staff Reports

    • Workload
    • Resource utilization
    • Availability
    • Preference fulfillment
    • Staff Satisfaction

    Time Reports

    • Time efficiency
    • Travel-time Analysis
    • Punctuality
    • Time utilization
    • Overtime Analysis

    Quality Reports

    • Care Time
    • Continuity
    • Punctuality
    • Service delivery
    • Compliance

    Key Features

    Custom Dashboards

    Create tailored dashboards for different roles and focus areas. Each user can customize their view to easily track the key metrics that matter most to them.

    Performance Analytics

    Comprehensive tools to analyze and optimize operational performance. Compare key metrics over time and identify trends and areas for improvement.

    Contract Compliance

    Track and verify that all contractual obligations are met. Automatic alerts when key metrics fall below agreed levels.

    Business Value

    Better Decisions

    With data-driven insights, managers and planners can make well-founded decisions based on real results rather than assumptions. This leads to optimized processes, better resource allocation, and greater operational value.

    Optimized Operations

    Through continuous follow-up and analysis, bottlenecks and inefficient processes are identified. Your operation can quickly adjust resource allocation, route planning, and scheduling to maximize efficiency.

    Greater Satisfaction

    Better scheduling and resource allocation lead to happier staff and care recipients. By tracking and optimizing quality metrics, both the work environment and quality of care improve.

    Benefits and ROI

    See how analytics can improve your operations

    Powerful Data Visualizations

    Clear visualizations for fast analysis and decision-making.

    Custom Reports

    Create your own reports based on your specific needs.

    Insights for Every Stakeholder

    Tailored insights for different roles within the organization.

    Deep dive

    How the workflow works in practice

    Product detail

    Analytics & Business Intelligence

    Product visuals
    Analytics & Business IntelligenceAnalytics & Business IntelligenceAnalytics & Business IntelligenceAnalytics & Business IntelligenceAnalytics & Business IntelligenceAnalytics & Business IntelligenceAnalytics & Business Intelligence

    Workflow section

    Analytics & Business Intelligence

    Consolidated dashboards that surface operational performance, financial outcomes, and optimization impact in real time.

    Workflow section

    Comprehensive Analytics Suite

    CAIRE provides five integrated analytics modules to give you complete visibility into your operations

    Workflow section

    Overview Dashboard

    Executive dashboard showing high-level KPIs and trends across all areas. Time period selectors (7/30/90 days), key performance indicators with trend arrows, and quick access to detailed sections.

    Workflow section

    Schedule Analytics

    Detailed analysis of schedule optimization performance. Track continuity scores, recaptured hours, assignment rates, and before/after optimization comparisons with performance badges.

    Workflow section

    Resource Analytics

    Tab-based analysis of employees, clients, service areas, and visits. Sortable tables, utilization metrics, hierarchical service area performance, and drill-down capabilities.

    Workflow section

    Financial Analytics

    Revenue tracking in SEK, cost analysis, margin calculations, and ROI metrics from AI optimization. Interactive charts with Swedish currency formatting throughout.

    Workflow section

    Operational Analytics

    Service delivery efficiency and quality metrics. Travel time optimization, constraint satisfaction rates, unused hours recapture, and efficiency benchmarks.

    Workflow section

    Executive analytics across every module

    The overview dashboard highlights organization-wide KPIs with consistent colour coding, trend indicators, and direct links to deeper analytics for scheduling, finance, and resources. Actuals

    Workflow section

    Actuals metrics sidebar with live KPIs

    Monitor completed scheduling with the Actuals sidebar surfacing real-time efficiency, time distribution, and visit outcomes directly alongside the professional calendar view.

    Workflow section

    Key Performance Indicators

    Track what matters most for your home care organization

    Workflow section

    📊 Real-Time Business Intelligence

    All metrics are calculated from actual optimization results and organizational data. No mock data – only real insights that drive decision-making and demonstrate tangible ROI.

    Workflow section

    💰 Financial Performance

    Total revenue, staff costs, margin percentages, and profitability trends. All displayed in SEK with Swedish locale formatting.

    Workflow section

    ⚡ Staff Utilization

    Percentage of productive time vs total working time. Track efficiency improvements from 65% to 70%+ through AI optimization.

    Workflow section

    🎯 Assignment Rates

    Percentage of visits successfully assigned to employees. Monitor unassigned visits and optimize resource allocation.

    Workflow section

    🚗 Travel Time Metrics

    Total travel time vs service time breakdown. Track 15-20% reductions in travel time through route optimization.

    Workflow section

    👥 Continuity Scores

    Number of different caregivers per client per month. Lower numbers indicate better continuity and care quality.

    Workflow section

    ♻️ Recaptured Hours

    Previously unused time slots converted to billable hours. Track potential revenue from optimized time utilization.

    Workflow section

    Full P&L visibility in Swedish krona

    Track total intäkter, personal costs, and net margin in real time with sparkline trends, variance indicators, and export-ready visualisations for each serviceområde. Operational

    Workflow section

    Operational efficiency at a glance

    Visualise personnel efficiency, arbetsbalans, client coverage, and time distribution across service, travel, and waiting to understand how optimisation impacts daily operations. Scheduling

    Workflow section

    Schedule outcomes over the month

    Monitor hur aktiva scheman presterar över tid, inklusive publiceringsstatus, utnyttjandegrad och framgångsgrad för varje optimeringskörning.

    Workflow section

    Resource Analytics

    Comprehensive insights into your most valuable assets: people, clients, and service areas

    Workflow section

    Organization Metrics

    Total employees (active vs inactive), total clients, number of service areas, organization-wide utilization percentage, and total revenue.

    Workflow section

    Service Area Performance

    Hierarchical service area analytics with level indicators, personnel count per area, visit metrics, assignment rates, time analytics, staff utilization, and financial metrics with margin calculations.

    Workflow section

    Employee Performance

    Sortable table with utilization percentage, total visits handled, hours worked, travel vs service time breakdown, revenue generated, and continuity scores with performance badges (Excellent/Good/Fair/Poor).

    Workflow section

    Client Metrics

    Service area assignments, total visits received, assignment success rates with progress bars, number of unique employees assigned, and continuity scores (fewer unique employees = higher score).

    Workflow section

    Visit Analytics

    Detailed visit log with client and employee assignments, service types (Hemtjänst, Medicinering, Hushållshjälp), visit duration in minutes, dates, and status badges (Completed/Scheduled/Cancelled).

    Workflow section

    Service-area planning foundation

    Review service area readiness, current schedule status, solution links, visit volume, and the operating context that downstream analytics depend on. Planning Context

    Workflow section

    Connect scenarios to resource data

    Keep scenarios, schedules, visit templates, districts, clients, and employees tied to the same service area so analytics and optimization read the same foundation. Data Completion

    Workflow section

    Close continuity gaps in batch

    Identify clients missing designated caregivers, filter the affected rows, and update continuity-critical data before relying on analytics or optimization. Visits

    Workflow section

    Visit distribution and outcomes

    Analys av besökstrender, typer, geografi och utfall över valbara tidsintervall för att säkerställa hög genomförandegrad och patientnöjdhet.

    Workflow section

    Financial & Operational Excellence

    Measure the business impact of AI-powered optimization

    Workflow section

    Revenue & Margin Tracking

    Real-time revenue tracking in SEK with Swedish locale formatting. Cost breakdowns by employee, service area, and service type. Margin analysis with profitability indicators and ROI comparison before/after optimization.

    Workflow section

    Cost Analysis

    Comprehensive cost tracking including staff costs, travel expenses, and overhead allocation. Interactive pie charts and bar charts showing cost distribution patterns and optimization opportunities.

    Workflow section

    Efficiency Metrics

    Travel time optimization tracking with percentage targets. Service quality scores and indicators. Constraint satisfaction rates. Unused hours recapture rates with potential revenue calculations.

    Workflow section

    Financial module with ROI breakdown

    Djupgående finansiell analys per serviceområde med stapeldiagram för intäkter och kostnader, marginalprocent, samt helikoptervy över total tid och tidsfördelning. ROI

    Workflow section

    Compare optimisation scenarios

    Jämför original, manuella och AI-optimerade scenarier med tydliga effektivitets-, marginal- och tilldelningsmått för att visa faktiska förbättringar.

    Workflow section

    Data-Driven Decision Making

    Transform raw data into strategic insights

    Workflow section

    🎯 Why Analytics Matter

    The analytics system provides transparency into the true ROI of AI optimization. Organizations can see exactly how much time, money, and resources are saved through intelligent scheduling. Every metric is traceable back to real optimization jobs and operational data.

    Workflow section

    📈 Trend Analysis

    Track improvements over time with historical comparisons. See how utilization rates, margins, and efficiency metrics evolve as you optimize.

    Workflow section

    🔍 Drill-Down Capabilities

    Start with high-level metrics and drill down to individual employees, clients, or service areas for detailed investigation.

    Workflow section

    📊 Customizable Views

    Sortable tables, filterable data, and multiple time period options allow you to analyze data exactly how you need it.

    Workflow section

    💡 Actionable Insights

    Performance badges, status indicators, and trend arrows help you quickly identify areas for improvement and celebrate successes.

    Workflow section

    🗂️ Export & Reporting

    Extract PDF or Excel reports for sharing with management. All analysis is centralized for easy access and continuous improvement initiatives.

    Workflow section

    🔄 Real-Time Updates

    Metrics update automatically as new optimization jobs complete. Always have current data for informed decision-making.

    Workflow section

    Getting Started with Analytics

    Four simple steps to unlock powerful insights

    Workflow section

    Set Up Organization

    Ensure your organizational data is complete with employees, clients, and service areas properly configured in the system.

    Workflow section

    Import & Optimize

    Import schedules and run AI optimizations. Each optimization job generates comprehensive metrics that feed the analytics system.

    Workflow section

    Explore Insights

    Navigate through the five analytics sections to understand performance, identify opportunities, and validate optimization results.

    Workflow section

    Take Action

    Use insights to refine optimization parameters, adjust resource allocation, and continuously improve operational efficiency.

    Workflow section

    Explore more of the CAIRE platform

    Connect your analytics insights with how schedules are built and resources are staffed by jumping to these sections.